A new approach to visualizing the stock market that is quick, simple, and perfect for busy investors - Stock Mosaic gives you a clear market overview full of insight into how the market is performing. The beautifully colored mosaic tiles indicate stocks and their price movement, instantly telling you whether investors are bullish or bearish towards the overall market, certain sectors, or individual stocks.
INSTANT MARKET OVERVIEW
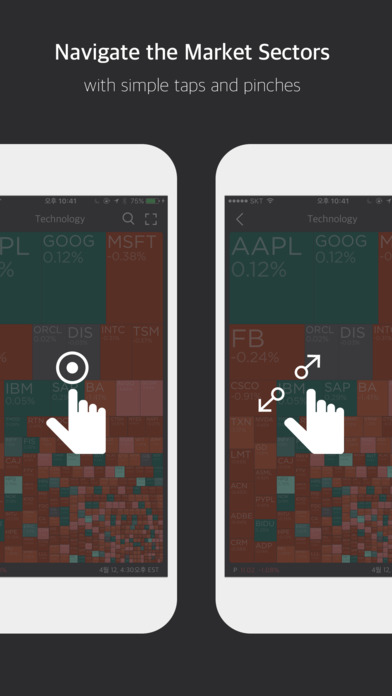
Stock Mosaic is based on Treemapping methodology and visualizes the stock market with a grid of colored boxes that represent listed companies. Larger boxes represent larger companies (e.g. AAPL or XOM), and smaller boxes represent smaller companies. All companies are grouped by Sector which makes it easy to see if investors are bullish or bearish towards a particular sector on a particular day.
PERFORMANCE AS COLORS
The performance of individual stocks is represented on a color scale. Outperforming stocks will be colored in green and declining stocks in red. Colors with brighter hues represent a stronger movement.
UNIQUE PERSPECTIVE
You can instantly understand how stocks are performing on any given day, and also navigate deeper into market sectors and individual stocks to find important details that will strengthen your investment analyses and stock choices.
INTUITIVE INTERFACE PACKED WITH INFORMATION
The mosaic tile interface (the “Treemap”) gives a concise and comprehensive view of the market presenting almost 2,000 stocks in a single view and supports more than 5,000 companies overall. This type of bird’s eye view of the market has not previously been possible with conventional linear and graph style presentations. For the busy investor, this represents a new and powerful perspective through which you can monitor your stock investments.
ZOOM IN FOR DETAILED ANALYSIS
A lot of information is packed into a single view, so there will be boxes that are too small to read at a glance. With its elegant zooming mechanism, Stock Mosaic allows users to tap and pinch into a particular sector, and further pinch/zoom to drill into the smaller companies.
DETAILED STOCK INFORMATION
Access detailed descriptions and financial information of individual companies. Market activity (current price, opening price, daily volume etc), Financial Ratios (P/E, EV/EBITDA), business descriptions, historical prices, and latest news are all available in the detailed stock view.
GLOBAL MARKET OBSERVATION
The US market is available in trial mode by default and can be fully unlocked via an in-app purchase. As of April 2017, the Canadian and Mexican markets are also available via in-app purchases. We are a small but dedicated team of developers busily expanding our support into other markets and will continually bring you frequent feature updates. As active investors ourselves we assure you that we’ll be working diligently to ensure that Stock Mosaic remains relevant and useful!
FEEDBACK & SUPPORT
Stock Mosaic has been designed by investors for investors. We hope you enjoy Stock Mosaic as much we do and would love to know how we can make your investing even more successful, so if you have any feedback that might further improve Stock Mosaic, please get in touch via the App Store “Support” link, or drop us a line at “[email protected]”.
Thanks!


